This work package will be carried out at the Swiss Federal Research Institute WSL.
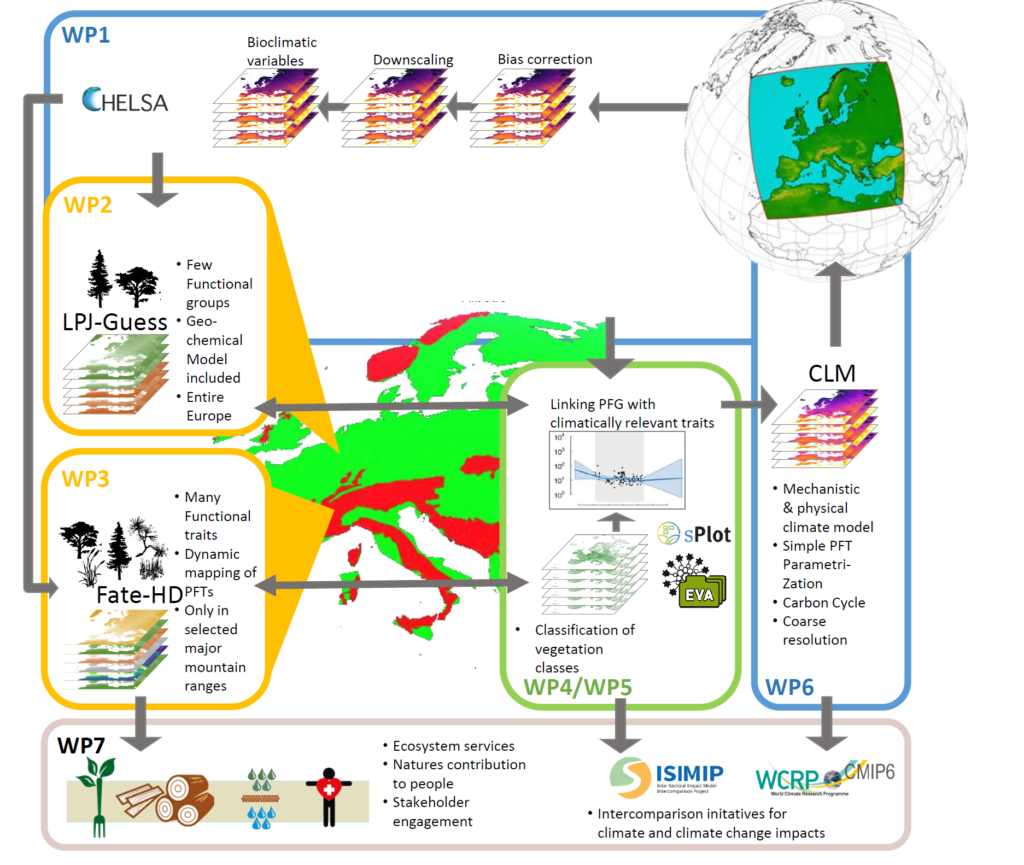
WP1 provides subsequent WPs with high-resolution data needed for the two dynamic vegetation models (DVMs); LPJ-GUESS (WP2) and Fate-HD (WP3), as well as for calibrating partial biodiversity models (WP4/WP5). WP6 will produce large amounts of climate data from the COSMO-CLM2 climate model, yet at a 0.11° grid resolution, which is too coarse to capture climate variation in complex terrain. Global circulation and weather models are already able to run at high horizontal resolutions close to 1 km, but are still heavily constrained by computational limits. Currently, numerical km-scale models are computationally too expensive for coupling them with DVMs and BD models. Therefore, we will apply a downscaling to the COSMO-CLM2 (see WP6) output based on the CHELSA algorithm. We will do so for a reduced set of climatic variables needed for impact studies, with a computational efficiency that is 745 times faster than a numerical model, and therefore suitable for downscaling COSMO-CLM2 output to a 1 km, or higher resolution. For each climate variable, we will develop a module to downscale the input data at daily resolution to 1 km for Europe and 100 m for the European mountain ranges. In addition to the high-resolution climate data, WP1 will also provide remotely sensed data from Sentinel2 to provide surface albedo to parametrize their relationship to climate.
Tasks
- Downscale bias corrected climate data: CLM modelled precipitation, temperature, and wind speed will be bias-corrected using the ISIMIP3b method following, which is a parametric quantile mapping method designed to adjust biases in all percentiles of a distribution of a climate variable while preserving trends in these percentiles including extremes. The downscaling of precipitation, temperature, wind speed, and solar radiation for DVMs and BD models in subsequent analysis will be performed using an updated CHELSA algorithm. This algorithm applies a series of statistical- and mechanistic downscaling routines to data provided at coarser (here CLM) resolution. Temperature and radiation are freely scalable and the method works on either 1 km resolution (Europe) or 100m (Mountains) resolution alike. Cloud cover and precipitation are only downscaled to 1 km, as further downscaling rather creates noise.
- Coupling of downscaling algorithms with DVMs: In this task, we develop, benchmark, and implement a routine that integrates COSMO-CLM2 with CHELSA, the DVMs, and the BD models, and explores feedbacks into the COSMO-CLM2 on an HPC system. This will allow better and more directly exploring BD effects on CLM- modelled climate data.
- Parametrization of BD climate relationships: Here, we replace the parametrizations in ESMs with more detailed schemes using the downscaled climate data, in combination with remotely sensed data (from Landsat, Sentinel2), LPJ-GUESS simulations in WP2 and classifications from WP4 to better represent BD-sensitive climate parameters (e.g. albedo, vegetation structure, etc.)
- Synthesizing the overall results of the project: This task will focus on the coordination and synthesis of the project to an integrated, high ranking scientific publication.
Milestones
Deliverables
Cover image: Jay Mantri, Unsplash.
This work package will be carried out at the Senckenberg Biodiversity and Climate Research Institute.
Dynamic global vegetation models simulate changes in vegetation composition in terms of Plant Functional Types (PFTs), shifts in vegetation types, tree mortality, vegetation structure and biogeochemical fluxes between the soil, vegetation and the atmosphere. In contrast to species distribution models, dynamic vegetation models represent ecosystem dynamics under non-equilibrium conditions, accounting for species interactions, and include plant-physiological effects of changing atmospheric nitrogen depositions and atmospheric CO2 concentrations, which can alter water and latent heat fluxes. We will apply the global model LPJ-GUESS21 with an updated parameterization of the main tree species in Europe. The model will be run at unprecedented high spatial resolution of 1-5 km across Europe on data from WP1. Tree species traits will be updated with data from TRY23. Further relevant model output includes carbon storage and timber production from disturbances such as fire, which are important for assessing and NCP. Similar to WP3, all BD relevant variables can be either excluded or randomized in the overall feedback loop (Fig. 1) allowing a quantification of their effect on the entire biodiversity-climate system.

Tasks
- Parameterizing additional tree species: The tree species parameters from Hickler et al. (2012) will be updated using latest information on, e.g., species traits from TRY and analyses by T5.1. Additional important species will be added in discussion with stakeholders.
- Implementing forest management: Instead of simulating potential natural dynamics, as in Hickler et al. 2012), the model will be initialized with the existing distribution of main tree species. The forest management tool will be adapted to represent main European forest management types. These types will be rather general, distinguishing, e.g. conifer plantations with thinning and harvest at certain biomass levels, and mixed forests with more natural dynamics.
- Developing future forest management scenarios: Simplified scenarios for future forest management, such as an increase in mixed stands and less conifer monocultures, will be developed together with stakeholders. A further focus will be comparing scenarios in which the species composition is allowed to adapt to climate change (from LPJ-GUESS), compared with a stronger focus on tree species that are planted now.
- Simulating future dynamic vegetation: The model will be run at 5 km resolution with climate forcing data from WP1 across Europe. For particular areas, which will be decided upon with stakeholders, the runs will be carried out at 1 km resolution, which would not be computationally feasible for the whole study area. Output variables will include vegetation characteristics and ecosystem functions that are particularly important for feedbacks on the climate system (e.g. evapotranspiration, tree height, vegetation phenology, PFT distribution) and variables that are closely linked to NCPs (e.g. wood production, carbon sequestration, habitat continuity for nature conservation).
Milestones
Deliverables
Title image: Ed Leszczynski, Unsplash.
This is a task of the LECA – Laboratoire d’écologie alpine.
WP3 will apply a dynamic vegetation model across the European mountain regions at 100m resolution. In the highly variable terrain of mountains, biodiversity-climate feedbacks are more complex, as high terrain heterogeneity leads to complex terrain-climate interactions. We will extend the dynamic landscape vegetation model FATE-HD developed at LECA with input from WP4 & WP5. FATE-HD7 simulates interactions between species or plant functional groups, the dynamics of cohorts, and dispersal, and considers disturbance regimes (e.g. fire, mowing or grazing) and environmental variation. In- and excluding these processes in the overall feedback loop (Fig. 1) will allow us to better understand their respective influence on the biodiversity-climate feedback. The processes that can be investigated in detail using the FATE-HD model are as follows.
- Plant functional group classification: to reduce the dimensionality of the simulations, we will first build functionally consistent and climatically classified PFGs using species data occurring in the Alps and their functional traits24.
- Succession: FATE-HD implements both interaction for light and for soil resources that directly impact germination, survival and mortality.
- Habitat suitability: The suitability of the pixel of each defined PFG will be modelled using species distribution modelling methods calibrated using the data from WP4 and WP5.
- Dispersal: FATE-HD uses a system similar to continuous kernel function but requires only a few parameters.
- Disturbances: Several disturbance models will be parameterized to remove vegetation, affect fecundity, kill seeds or activate dormant seeds. As high thematic complexity (many PFTs, dispersal, etc.) prevents this model from being run across Europe, but can represent the vegetation dynamics in complex terrain with more detail than e,g, LPJ-GUESS (WP2).
Tasks
- Optimisation of FATE-HD for the European Mountain ranges: We will extend FATE-HD regarding computing efficiency to allow running it over the European Mountain ranges at 100m resolution for about 50 PFGs. We will use the vegetation plot data from WP4 and traits (e.g. light response, seed mass, longevity) from WP5 to build the PFGs following our optimized protocol24. Climatic layers will be provided by WP1. Particular attention will be paid to gather relevant climatic variables such as snow cover and length of the vegetation period for realistic vegetation dynamics simulation. Data on land use, especially mowing for grazing will be gathered from local sources and satellite imageries.
- Simulation of vegetation dynamics across the entire European Mountain ranges: We will simulate the dynamics of PFGs across the European Mountain ranges under past and current conditions until we reach an equilibrium state. The equilibrium state will be validated against remotely-sensed databases such as Sentinel-2A. Once validated or/and fine-tuned, we will simulate future plant dynamics, yearly, across the next century, using the climate change scenarios provided in downscaled form by WP1.
- Disentangling the drivers of vegetation dynamics and providing scenarios for climate-biodiversity feedbacks: The simulations as in T3.2 are run, but some of the processes and influencing biodiversity-climate feedbacks are switching off/on. We will specifically investigate combination relevant for co-existence theory:
- neutral simulations, where only dispersal will be integrated (no effect of interactions);
- habitat filtering, where only habitat suitability will drive the whole dynamics;
- competition tradeoffs, where only interactions for light or soil resources will be switched on.
- The different simulation experiments will be evaluated using the same protocols as for T3.2 and outcomes will be given to WP1 for processing for WP6.
Milestones
Deliverables
Cover image: Marco Meyer, Unsplash.
This is a task of the Masaryk University, MUNI.
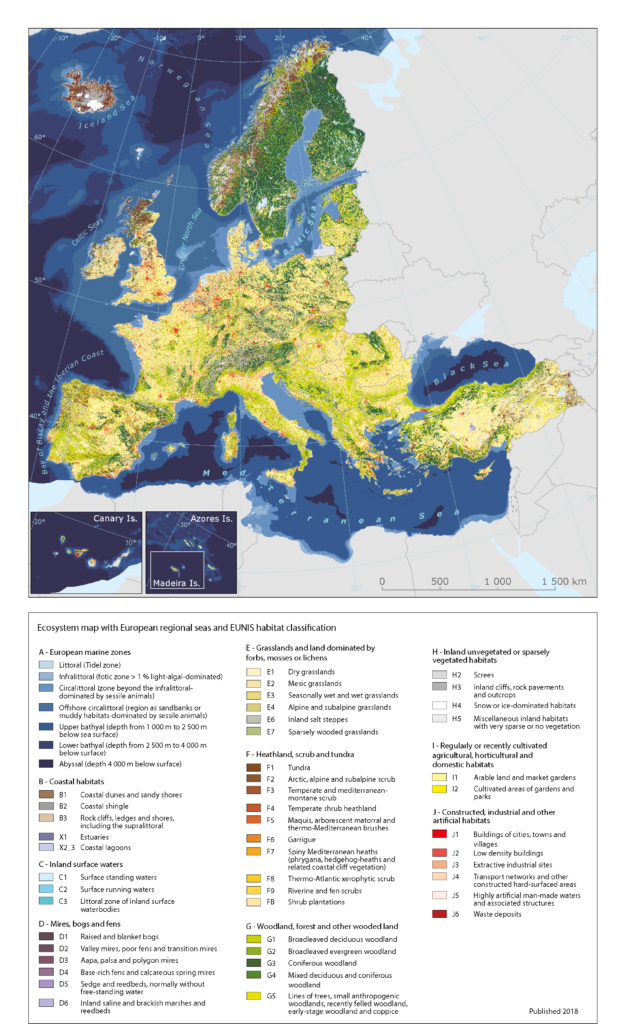
An effective integration of biodiversity into climate models heavily relies on the meaningful and detailed classification of vegetation structures along biodiversity gradients. Until now, vegetation classifications in climate models are comparably simple and the biodiversity component is entirely missing. A species-rich forest or grassland is treated similarly in its effects as its species-poor counterpart. Since species richness and its functional attributes are partly driven by climate drivers and responds with changes in physical structures when climate is changing, a better understanding of the biodiversity feedback to climate is needed. In WP4, we provide information on how to add more detail on vegetation structure and biodiversity (Fig. 1) to the dynamic simulations generated in WP2. We will apply the EUNIS Habitat Classification scheme, a standard classification of European vegetation used by the European Environment Agency (EEA). This classification will be applied to a set of approximately 1.6 million vegetation plots from the European Vegetation Archive (EVA) 26. The EUNIS types will be aggregated into classes that represent those modelled by the DVMs in WP2 & WP3. Vegetation classes will be characterized in terms of the floristic composition, ecology, dynamics, distribution, and economic or conservation value, which will be needed in WP7. Linking these classes and their species composition and richness to climatically relevant features such as their albedo, structure, etc. will additionally allow quantifying their contribution and feedbacks to the climate system (prepared in WP1, assessed in WP6).
Tasks
- Optimization of vegetation classification: An EUNIS classification developed by our team for the EEA will be used to classify vegetation plots from EVA into vegetation types to approximately 300 classes. These classes will be compared in terms of their plant functional trait spectra and biodiversity and merged into a smaller number of internally homogeneous classes that can serve as operational units for WP1, WP5, WP6 and WP7. A finer classification will be proposed for mountain vegetation and used as an input for WP3. The expert system will be adjusted to identify vegetation types directly at selected resolutions. Gaps in geographic coverage of these classes will be identified and closed as much as possible through targeted data acquisition via the EVA network and digitization of available data hardcopy sources.
- Species richness of vegetation classes: Vegetation types obtained in T4.2 will be used for species richness modelling based on the methods proposed by 27 and 28. Species data from vegetation plots will be divided into growth forms (e.g. trees, shrubs, dwarf shrubs, perennial herbs, annual herbs etc.) and leaf types (e.g. needle, evergreen broadleaf, deciduous broadleaf), and species richness of these PFTs and vegetation types will be modelled separately, assuming that diversity feedbacks may differ considerably among these plant functional types that determined the basic structure of vegetation. Species richness models will be recomputed after each run of the dynamic vegetation model in order to quantify the changes in species richness patterns due to changes in dynamic vegetation model.
Milestones
Deliverables
Cover image: Sharissa Johnson, Unsplash.
This is a task of the Martin-Luther-Universität Halle-Wittenberg, MLU.
WP5 links the climatically relevant vegetation classes from WP4 to important biodiversity metrics relating to functional trait composition and biodiversity. Although we know that many traits such as wood density, leaf chemistry, or leaf nutrient contents are linked to climate-relevant ecosystem functions such as carbon sequestration and evapotranspiration, and are themselves correlated with temperature and precipitation30, we still lack many details on how traits actually provide feedbacks to climate. WP5 will quantify the relationships between climate, ecosystem functional composition and diversity, focusing in particular on traits related to climatically relevant parameters such as albedo and evapotranspiration. Thus, we go beyond the coarse representation of vegetation by few PFTs to predict climate-related processes, and focus on those PFTs that reflect transpiration, growth and successional status of vegetation. e.g. identified that litter (the organic material on the forest floor) such as leaves and woody debris is the most relevant predictor for albedo, while the amount of understory vegetation was most important for predicting evapotranspiration. In contrast, the traits of the classical leaf economics spectrum had only a minor impact on model results. We thus plan to include further traits relevant for litter decomposition such as leaf toughness and phenolics content and for transpiration control, such as stomata density. We will use a Bayesian hierarchical modelling approach and first investigate how ecosystem trait composition varies with respect to climatic variables produced in WP1 and the vegetation classes from WP5. We model the joint distribution of the values of the different traits at the plot-level and then aggregate these distributions by the vegetation classes of WP4, also providing estimates for community-weighted trait mean values (CWM) and trait variances (CWV). We then quantify the predicted shift in trait value distribution on those ecosystem functions that affect climate- relevant processes. The inclusion of plant traits will provide a deeper understanding of the effect of specific plant trait compositions on the biodiversity – climate feedback.
Tasks
- Linking traits to species databases and vegetation plots: Compile the relevant traits from the TRY database and other available sources, with a focus on traits related to albedo,
- evapotranspiration and productivity, and link them to the species data from the EVA database. Traits that are needed in WP2 but unavailable for many species will be estimated using co-varying traits and environmental information. In addition, we will use the approach used in the global vegetation plot database and impute missing trait values. Trait value distributions (as probability density function of traits per pixel), CWM, CWV and taxonomic diversity will be calculated for all vegetation classes defined in WP4 and mapped across Europe.
- Quantifying trait effects on climate relevant parameters: The impact of CWM and CWV of different traits as well as species richness from WP4 on climate-relevant processes will be used in a multimodel inference framework with variance partitioning (e.g. Serna-Chavez et al. 2018), using null models that consider the underlying community structure of the vegetation plots.
Milestones
Deliverables
Cover image: Keith Davey, Unsplash.
This is a task of the Swiss Federal Institute of Technology in Zurich, ETH.
To assess the feedback of changes in BD facets on the climate system we use the integrated COSMO-CLM2 regional climate model8. The COSMO climate model is coupled to the Community Land Model (CLM), which in turn represents the land surface feedbacks to the climate model. The COSMO-CLM2 modeling system, which captures plant photosynthesis and carbon processes constitutes a regional Earth System Model. CLM also allows to investigate potential feedbacks of modified land water or energy fluxes for the regional climate11, and in particular extreme events, and it represents several aspects of specific vegetation processes. However, there are two important constraints that prevent the model from enabling the assessment of feedbacks from BD change on climate. First, COSMO-CLM2 does not track BD change explicitly as it does not track subtle changes in vegetation structure except for very broad functional types. Therefore, data provided at finer thematic and spatial resolution from WP2 & WP3 are used as forcing to COSMO-CLM2. Second, the model is operated at a comparably coarse spatial resolution of ca. 12.5 km, which is coarser than model simulations in WP2 and WP3. We will therefore replace parts of the CLM dynamics with spatially distributed input from WP2 (dynamic simulations over Europe), WP3 (dynamic simulations over the Alps) and WP4 (more detailed vegetation classification not provided in WP2). These data will be aggregated and prepared by WP1 (spatially distributed time series of LSM properties for input in WP6) from finer spatial resolution to the COSMO-CLM2 12.5 km raster. This will allow us to compare standard COSMO-CLM2 model runs with a) those provided at higher thematic and spatial resolution so that the effect size of BD feedbacks to the climate system can be quantified, or b) with targeted scenario simulations of vegetation dynamics as requested by stakeholders. We will do so in two steps, first by replacing structural aspects of the few broad functional types with more subtle vegetation details as input to the COSMO-CLM2, and then to also replace more physiological parameters as input to CLM. The experiments with the modified COSMO-CLM2 model will be run to investigate biodiversity feedbacks to climate.
Tasks
- Adjust the CLM model structure and run first set of experiments: Adjust the CLM model structure such that it reads spatially distributed time series of land surface input for albedo, canopy height & roughness, LAI, and SLA provided by WP1 (M1.3). Run a first set of simulations to provide the coarse climate input data for the downscaling in WP1, and simulations in WP2 & WP3.
- Adjust the CLM model structure further and run second set of experiments, such that it also reads spatially distributed time series of evapotranspiration, Vcmax and stomatal conductance provided by WP1 (M1.3). Run experiments on BD feedback on climate change using the time series provided by WP2 & WP3 as forcing input (with aspects of BD either fully modeled, or held constant). Run experiments in response to stakeholder input.
Milestones
Deliverables
Cover image: The National Oceanic and Atmospheric Administration (NOAA) on Unsplash.
This is a task of the Stockholm Resilience Center, SRC.
This WP will investigate the impacts of climate driven biodiversity change on natures contribution to people (NCPs). We will investigate:
- the current spatial distribution of multiple NCPs;
- the current interactions among NCPs in the form of trade-offs or synergies, including potential bundles of NCPs42;
- the impacts of climate change in the current distribution of NCPs and their relationships.
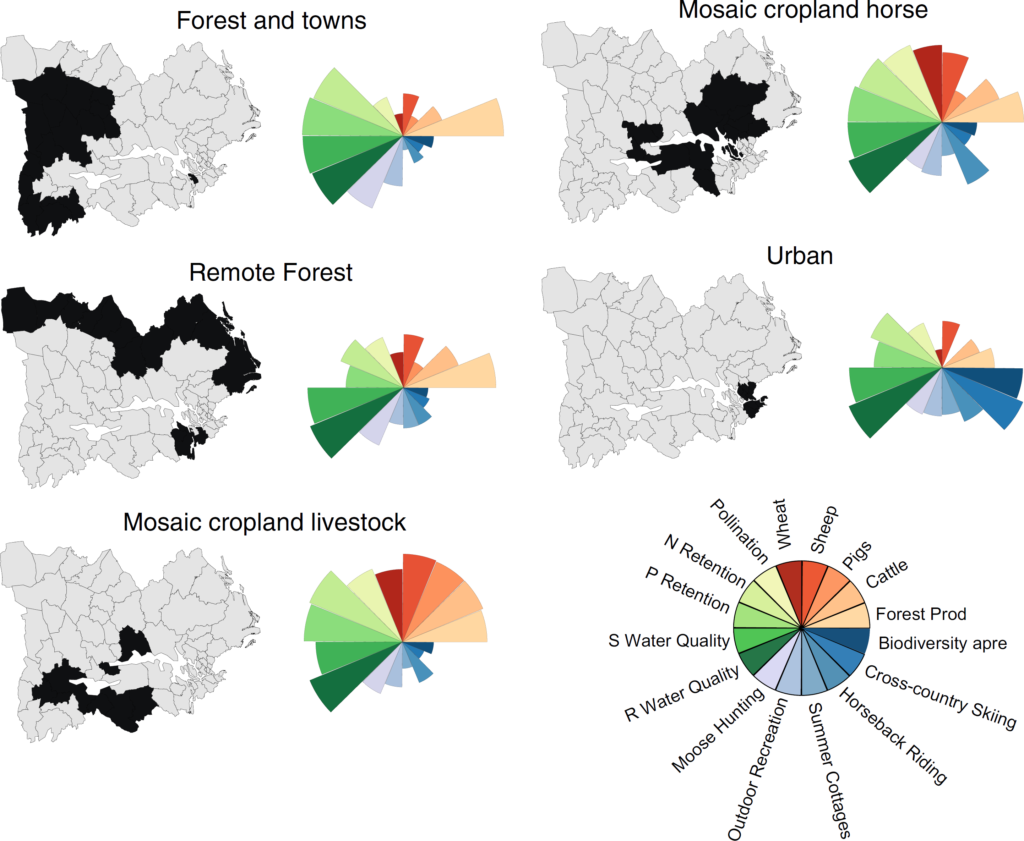
For the assessment of individual NCPs we will use a functional traits approach to explore the links between plant species and the mechanisms underlying ecosystem functions underpinning the generation and flow of services. We will identify which NCPs are most relevant to the Alps and European contexts by engaging with local and regional stakeholders through semi-structured interviews and participatory exercises. By engaging stakeholders from an early phase, we increase the relevance of our findings to inform decision making in ways that relate to the specific contexts and scales in which these actors are operating. Based on our selection of NCPs, we will use effect traits, that determine the functions that a certain organism performs in the ecosystem at a certain point in time, to link plant species diversity with individual NCPs, in a similar approach to the one in WP5. The assessment will be conducted at the European scale and for the Alps region. The regional analysis (Alps) will be a more in-depth analysis, covering a broader range of NCPs and including (for some NCPs) qualitative data on local and regional stakeholders’ perceptions and preferences.
Tasks
- Assessment of the provision and distribution of individual NCPs: After engaging with local and regional stakeholder to identify a range of NCPs for the European and regional (Alps) analysis, we will combine literature sources with expert knowledge to identify a range of effect traits that are relevant to the ecosystem functions that underpin each NCP (species data from the EVA database described in WP4, effect traits data retrieved from global trait databases TRY and BIEN). The provision of an individual NCP in a spatial unit will be given by the combined values for effect traits generated by the distribution of species present in that same unit. Since many non-material NCPs (also called cultural ecosystem services) are tightly connected with the way humans experience nature, in Alps regional assessment, the selection of effect traits for non-material NCPs will be informed by qualitative data on stakeholder preferences and experiencing of nature.
- Assessment of current interactions among NCPs: This assessment serves to identify potential trade-offs and synergies, as well as investigating the existence of bundles of NCPs, using correlation and cluster analysis as developed previously.
- Assessment of climate change impacts on the provisioning of individual NCPs: We will investigate the effects of climate driven changes on species diversity and distribution identified in WP2 and WP3 on the provisioning of individual NCPs (given by changes on the distribution of effect traits associated with the functions underlying each NCP).
- Assessment of the impacts of BD change on existing relationships among NCPs: In this task, we will assess if new trade-offs or synergies between NCPs are emerging through climate driven biodiversity changes.
Milestones
Deliverables
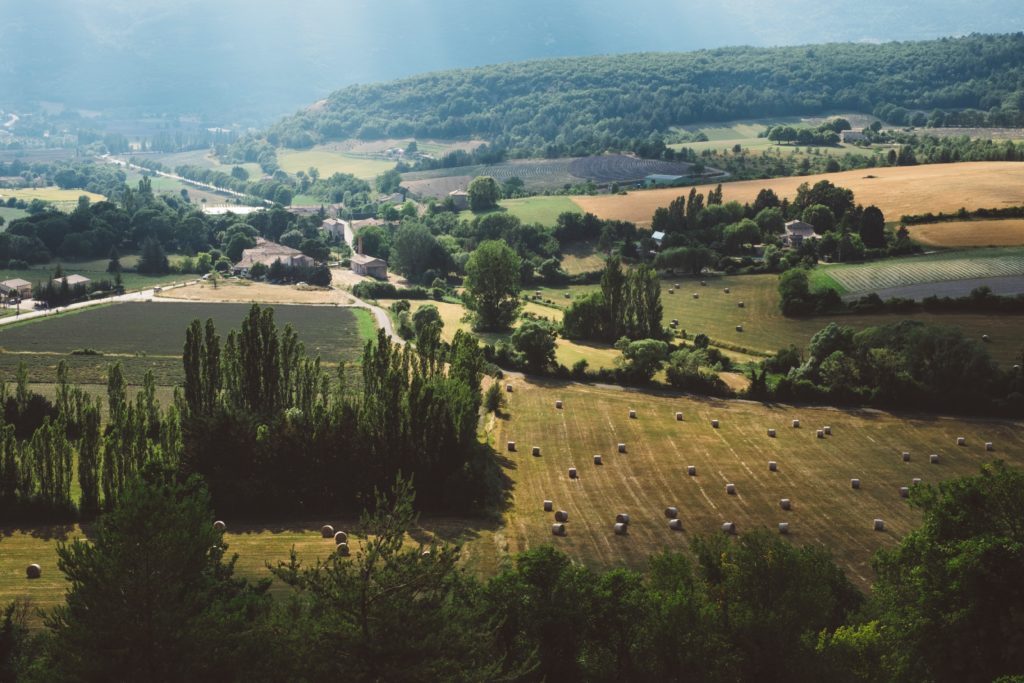
Cover image: Jacqueline O’Gara, Unsplash.